Quick answer: Many AI workload incidents in Kubernetes show up first as OOMKilled pods, node MemoryPressure, or eviction behavior rather than clean CPU saturation. The reason is simple: memory grows in messy bursts, Kubernetes enforces memory limits reactively, and responders usually need more context than a dashboard gives them.
TL;DR
- AI workloads in Kubernetes are not just compute-heavy. They are often memory-volatile.
- CPU pressure usually looks obvious. Memory pressure is sneakier and fails harder.
- Kubernetes enforces CPU limits with throttling, but memory limits through OOM kills when pressure appears.
- Node-pressure eviction can terminate pods quickly when available memory drops too far.
- Faster incident context matters because the right next action is rarely “add more nodes” by default.
What problem are we solving?
A lot of teams go into AI workload operations with the wrong mental model.
They assume the first production problem will be CPU.
That sounds reasonable. Inference is expensive. Embedding pipelines chew resources. GPUs are costly. Everyone talks about throughput.
But when incidents actually happen, the first visible symptom is often something else:
- pods restart with OOMKilled
- one container in a multi-container pod crashes while CPU still looks acceptable
- nodes flip into MemoryPressure
- latency spikes because the workload is being restarted, evicted, or squeezed by neighboring pods
- responders lose 20 minutes arguing about whether this is a leak, a limit problem, a bad deploy, or a noisy node
That is the operational gap this article is about.
Short answer
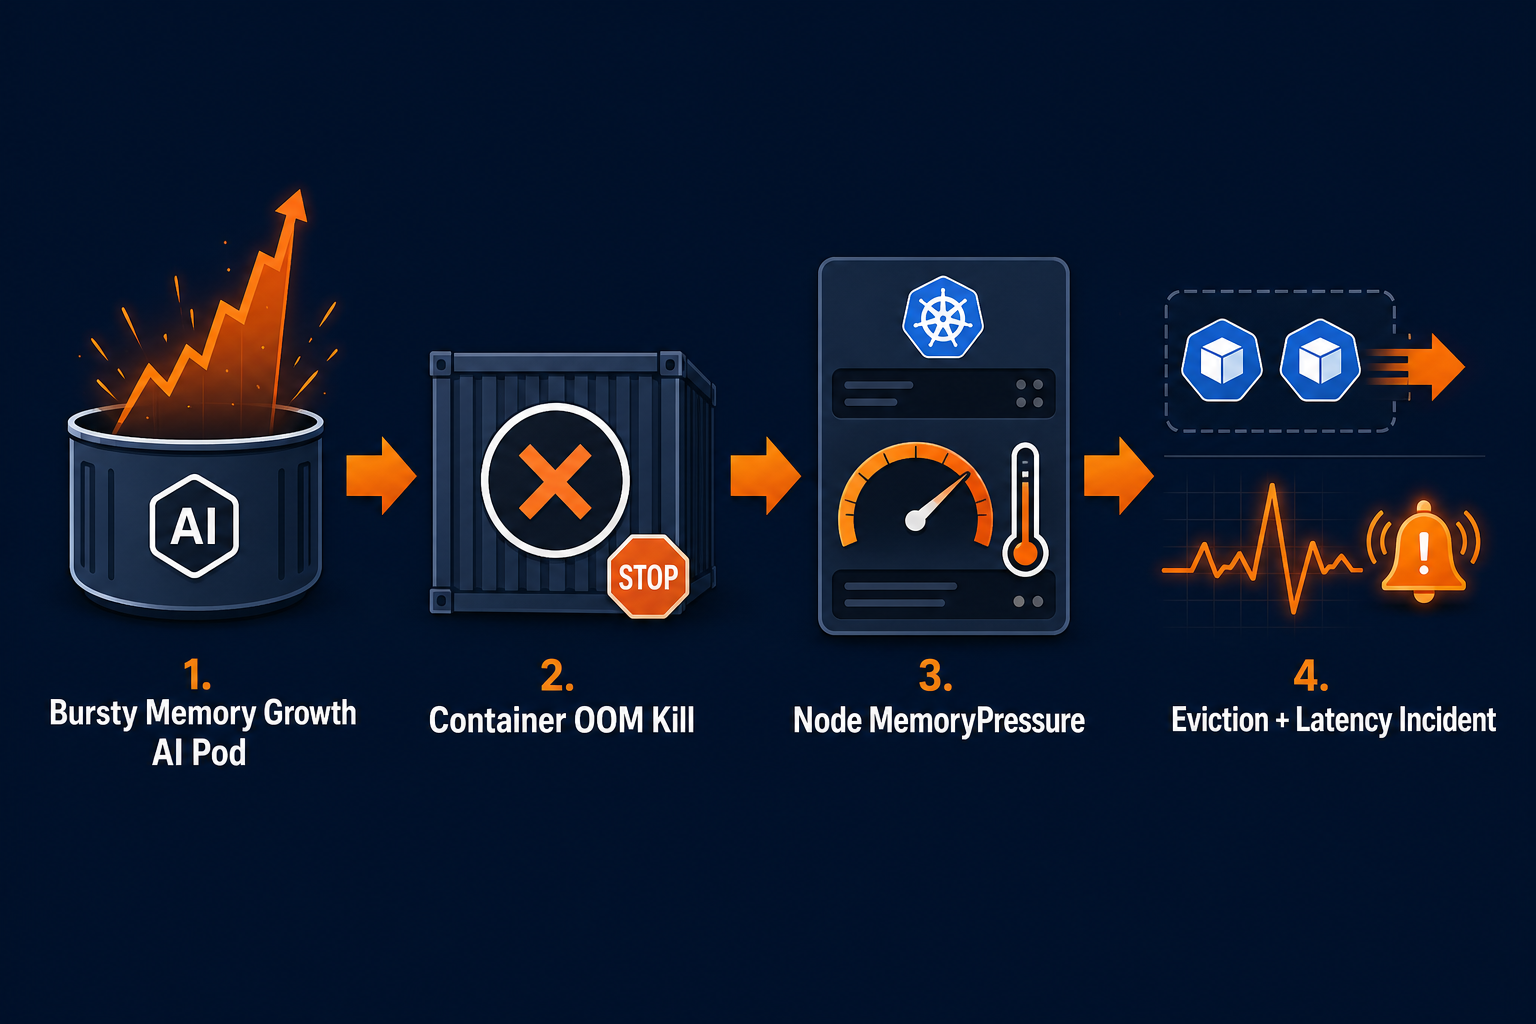
Kubernetes AI workloads often fail first at memory pressure because memory behavior is bursty, layered, and reactive.
CPU usually degrades more gracefully. A workload gets throttled. Performance drops. You can often see the pattern coming.
Memory incidents are harsher. The kernel and kubelet step in after pressure is already real. That means responders get paged for a symptom that is already disruptive: a kill, an eviction, a restart, or a noisy node.
Why CPU is the wrong first mental model
Kubernetes handles CPU and memory very differently.
According to the Kubernetes resource management docs, CPU limits are enforced by throttling. Memory limits are enforced reactively with OOM kills when the kernel detects pressure. That one distinction changes the whole incident shape.
When a container approaches its CPU limit, it slows down. When a container crosses into damaging memory behavior, it may just die.
That matters even more for AI-serving stacks, where total memory footprint can include:
- model weights in memory
- request batching buffers
- tokenizer and preprocessing layers
- sidecars for logging, service mesh, or security
- caches for prompts, vectors, or session context
- temporary spikes from rollout mismatches or concurrency bursts
None of that is very dramatic on an architecture diagram. It gets dramatic fast in production.
The incident usually starts as invisible memory growth, not a cinematic CPU wall.
How memory pressure actually surfaces in Kubernetes
There are two layers operators need to think about.
Container-level failure
A container exceeds its usable memory boundary and gets OOM killed.
This can look deceptively small at first. One pod restarts. A single model-serving replica flaps. A queue processor falls behind.
But because memory enforcement is reactive, the first alert often arrives after user-facing symptoms have already started.
Node-level pressure
Kubernetes also watches node-level memory availability.
The kubelet uses signals like memory.available and can proactively evict pods when thresholds are met. The node-pressure eviction docs are blunt about this: hard thresholds can result in immediate termination.
This is where incidents become noisy.
Now the team is not just debugging one container. They are debugging contention, scheduling assumptions, priority, recent changes, and which workloads are getting squeezed off the node.
Why AI and AI-adjacent workloads make this worse
I do not think the issue is that AI workloads are uniquely broken. It is that they combine several properties that are awkward for incident response.
1. Working-set growth is uneven
A pod can look healthy during normal load, then spike memory when prompt size grows, concurrency shifts, retrieval payloads expand, or a new model version changes footprint.
2. Requests and limits are often tuned from incomplete evidence
The scheduler places pods based on requests, not future spikes. So a workload can fit nicely on paper and still fail later when real traffic hits its upper edge.
3. Multi-container pods hide blame
The “AI service” may not be the only thing consuming memory. Logging agents, proxies, security sidecars, and helper containers all contribute to the pod-level story.
4. Incident symptoms look indirect
Teams often first see:
- latency regressions
- downstream timeouts
- replica churn
- noisy autoscaling behavior
- failed rollouts
By the time someone checks memory, the trail is already messy.
What responders should check first
When a Kubernetes AI workload starts failing like this, I would not start with a generic “cluster is underprovisioned” story. I would start with five fast checks.
1. Recent changes
- Did a rollout change model size, concurrency, sidecars, or request defaults?
- Did a config change raise traffic or batching behavior?
2. Pod requests and limits
- Are memory requests unrealistically low for real runtime behavior?
- Are limits tight enough to trigger avoidable OOM kills during burst conditions?
3. OOMKilled and eviction evidence
- Which container is being killed?
- Is the pod being restarted from container-level OOM, node eviction, or both?
4. Node conditions
- Is the node reporting MemoryPressure?
- Are several workloads on the same node competing for headroom?
5. Ownership and blast radius
- Who owns the workload?
- Which dependent services are now degraded because one “small” pod keeps flapping?
This is where many teams burn time. The signals exist, but the story is fragmented.
The technical problem is memory. The human problem is assembling the story fast enough to act.
Why faster context changes the outcome
The difference between a quick fix and an hour-long incident is often not raw observability. It is time-to-context.
Responders need to know:
- what changed
- which workloads are really in scope
- whether the failure is container-level or node-level
- whether this is a bad limit, a rollout effect, a traffic change, or a leak
- what the safest next action is
Without that context, teams default to broad moves:
- scale the node pool
- roll everything back
- restart the workload repeatedly
- widen limits without understanding the node impact
Sometimes those moves help. Sometimes they just create a more expensive mystery.
Where OpsRabbit fits
OpsRabbit is useful in exactly this middle layer.
Not by pretending every OOM event is magical. Not by replacing platform fundamentals.
The value is compressing the time between “pods are flapping” and “we know what changed, who owns it, which evidence matters, and what to try next.”
For memory-pressure incidents, that means helping responders connect:
- recent deployment or config changes
- affected services and likely owners
- runtime evidence from the failing path
- the most likely blast radius
- the safest next investigation step
That is how teams move from reactive guessing to controlled response.
Final thought
AI workloads are making Kubernetes incidents weirder, not because CPU stopped mattering, but because memory behavior is easier to underestimate and harder to debug under pressure.
If your first mental model is “watch CPU harder,” you will miss the shape of the real problem.
A better model is this:
How quickly can we see memory pressure forming, understand what changed, and decide on the narrowest useful next action?
That is the difference between a restart loop and a real investigation.
FAQs
Why do Kubernetes AI workloads hit memory issues before CPU issues?
Because memory grows unevenly across models, caches, sidecars, and request bursts, while Kubernetes enforces memory limits reactively through OOM kills and evictions.
What should responders check first during a memory-pressure incident?
Start with recent changes, pod requests and limits, OOMKilled events, node MemoryPressure status, and which containers inside the pod are contributing to working-set growth.
Sources
- Resource Management for Pods and Containers - Kubernetes Documentation.
- Node-pressure Eviction - Kubernetes Documentation.
- Troubleshoot OOM events - Google Kubernetes Engine Documentation.
Last Updated
2026-05-02
Ready to Transform Your Operations?
Ask for a demo today. Experience how OpsRabbit can reduce your MTTR by up to 90%.